Notes from Slides:
Slide 4: Mechanisms
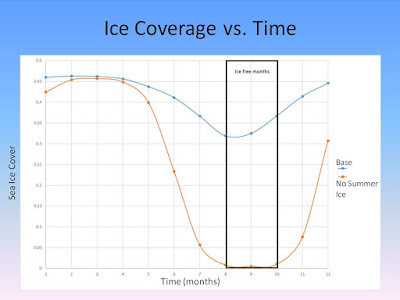
We initially set the XMAXD to be equal to 1, but this didn’t cause the ice to go away completely, so we changed the parameter to 0.5 which gave us three ice-free months: August, September, and October.
The NAO index is our proxy for the Jet Stream strength. We looked at the mean averages for the Pressure at Sea Level in Iceland and the Azores, the two locations all the literature and NASA/NOAA use for their data collection. Due to Panoply’s limitations we pinned the locations with the SELLONLATBOX to specific grid boxes and then normalized our data at each location by taking the PSL and subtracting the Long Term Mean, then dividing by the long term standard deviation. Once we had these two data points, we subtracted them to get the Normalized NAO.
Slide 5: Jet Stream
As air rises over the Equator and moves towards the poles, it keeps moving Eastward at the same rate, even though the higher it goes, the slower the Earth is spinning. This creates ribbons of very fast moving air called Jet streams, or narrow bands of strong air currents encircling the globe. Remember that Wind is caused by air flowing from an area of high pressure to an area of low pressure. Hot air rising generally gives you a higher precipitation and lower pressure. This is typically found in tropical or boreal biomes like the Equator. Cold air falling normally means lower precipitation rates and higher pressure and can typically be found in deserts and the poles.
This effects the Jet Stream as well. The Northern Hemisphere's polar jet stream is a fast-moving belt of westerly winds that traverses the lower layers of the atmosphere. The jet is created by the convergence of cold air masses descending from the Arctic and rising warm air from the tropics. Deep troughs and steep ridges emerge as the denser cold air sinks and deflects warm air regions north, giving the jet stream its wavy appearance. This pattern propagates across the mid-latitudes of North America, Europe and Asia, as pockets of cold air sporadically creep down from the Arctic - creating contrasting waves and flows that accelerate eastward due to Earth's rotation.
Slide 7: Ice vs Time
We managed to get the ice coverage down to 0.01 during the months of August – October as shown by the orange line (xmaxd).
Slide 8: Temp
We then looked at those same months vs. temperatures in both Panoply (top left) and through the data from our .nc files (bottom right). As you can see there is a temperature rise during the 3 months we removed the ice. Which makes sense.
Slide 9: NOA
When reading the graph, you can use the cheat above: a negative NAO means a weak Jet Stream and a Positive NAO means a strong Jet Stream.
Second Question! How does no sea ice effect the jet stream?
In the base, the NAO weakens between June and September, in our test, the NAO is at or below 0 from June – December. The seasonality follows closely between the two NAO graphs, but the test model generally shows a weaker jet stream throughout the year, which means that the sea ice loss during the summer effects the jet stream throughout the year.
Other things we found out:
The problem is that the jet stream doesn't stay at that fixed location, which means when you run the numbers, the strength of the jet stream is underestimated once it shifts to another location.
Slide 10:
First question! How does no ice effect global temps?
We hypothesised that no ice would increase the temps in the Arctic, but decrease in the Mid-Lat. because the cool air would slide down to the lower latitudes due to a weaker jet stream. However, we found that the temperature in the Mid-Lat. actually increases between 1-2K throughout the year, so there is no drastic change. In the Arctic region we do see a drastic change, almost 12K increase in the winter versus the base data.
Slide 11:
Third Question! Correlation or Causation between the jet stream and temperature?
When we compared the temperatures at the Arctic and the Mid-Latitudes to see if changing the ice really had an impact on the jet stream, and therefore the temperature, we were surprised. We anticipated seeing a drastic temperature drop and weakened jet stream, what we actually see is a weakened jet stream but a temperature increase.
We concluded that our hypothesis was wrong and that the jet stream did not act the way we thought it would. This means there are probably other processes acting we didn’t take into account, or that the effect we see is just too small to really impact it.
Ice decrease --> effects temperature --> changes (slightly) the jet stream = causation.


No comments:
Post a Comment